Q1. Given below are the heights ( in cm) of 11 boys of a class: 146, 143, 148, 132, 128, 139, 140, 152, 154, 142, 149. Arrange the above data in ascending order and find: (i) The height of the tallest boy. (ii) The height of the shortest boy. (iii) The range of the given data.
Solution
Arranging the given data, we get: 128, 132, 139, 140, 142, 143, 146, 148, 149, 152, 154 From the above data, we get: (i) The height of the tallest boy = 154 cm. (ii) The height of the shortest boy = 128 cm. (iii) Range of the given data = (154-128) cm = 26 cm.
Q2. Given below is the distribution of marks scored by some students in an examination:
Marks
50-60
60-70
70-80
80-90
90-100
Number of students
10
9
6
3
2
(1) What is the class size?
(2) What is the upper limit of the class interval 80-90?
(3) The results of how many students are recorded here?
Solution
(1) Class size = Upper limit - Lower limit = 60 - 50 = 10
(2) The upper limit of the class interval 80-90 is 90.
(3) Total number of students = 10 + 9 + 6 + 3 + 2 = 30
Thus, the results of 30 students are recorded.
Q3. A card is drawn at random from a well shuffled deck of playing cards. Find the probability that the card drawn is a red card.
Solution

Q4. The following table
shows various modes of transport used by 1500 students of a school.
Mode
of transport
Bicycle
Bus
Walk
Train
Car
Number
of students
800
300
160
100
140
Draw a bar graph to
represent the above data.
Solution
Q5. The number of children in 20 families of a locality are: 2, 2, 3, 1, 1, 2, 3, 2, 2, 1, 2, 2, 3, 1, 2, 1, 1, 3, 2, 2 State the frequency of each observation.
Solution
Arranging the data in ascending order, we get: 1, 1, 1, 1, 1, 1, 2, 2, 2, 2, 2, 2, 2, 2, 2, 2, 3, 3, 3, 3 We find that: 1 occurs 6 times 2 occurs 10 times 3 occurs 4 times Therefore, The frequency of families having 1 child is 6 The frequency of families having 2 children is 10 The frequency of families having 3 children is 4
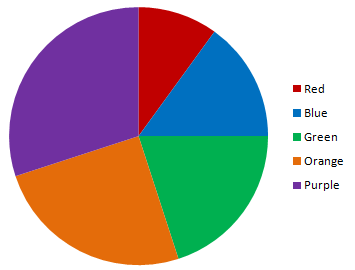
Q6. The following table shows voting results of the colour preference of students.
Colour
Numbers
Red
20
Blue
30
Green
40
Orange
50
Purple
60
Draw a pie chart showing above information.
Solution

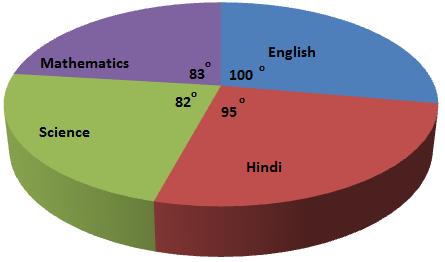
Q7. Marks
obtained by a student in an examination are given below. Draw a pie diagram
representing this information:
Subjects
English
Hindi
Science
Mathematics
Marks
100
95
82
83
Solution
Subjects
Marks
Measure of the central angle
English
100
 Hindi
95
Hindi
95
 Science
82
Science
82
 Mathematics
83
Mathematics
83
 Total
360
360
Total
360
360
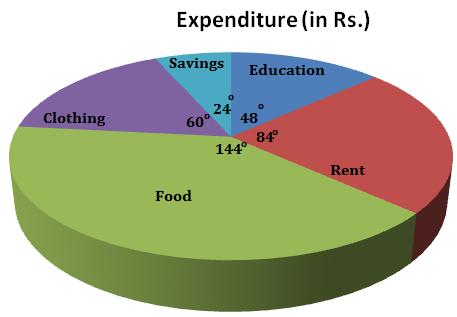
Q8. The monthly income of
a family is Rs. 15000. The monthly expenditure of the family on various items
is given below.
Items
Education
Rent
Food
Clothing
Savings
Expenditure
(in
Rs.)
2000
3500
6000
2500
1000
Represent the above
data using a pie diagram.
Solution
Items
Expenditure
(in Rs.)
Measure of the central angle
Education
2000
 Rent
3500
Rent
3500
 Food
6000
Food
6000
 Clothing
2500
Clothing
2500
 Savings
1000
Savings
1000
 Total
15000
360
On the basis of the table, the pie
diagram is as shown:
Total
15000
360
On the basis of the table, the pie
diagram is as shown:
Q9. Complete the following table:
Classes
5-10
10-15
15-20
20-25
Class Marks
12.5
Solution
 Thus, we have
Classes
5-10
10-15
15-20
20-25
Class Marks
7.5
12.5
17.5
22.5
Thus, we have
Classes
5-10
10-15
15-20
20-25
Class Marks
7.5
12.5
17.5
22.5
Q10. What is data and what is the need to organize data?
Solution
A collection of numerical facts regarding a particular type of information is called data. It is not easy to understand a raw data. To draw meaningful inferences and work upon it, we need to organize the data systematically.
Comments
Post a Comment